
4.5.3 Debug (Advanced Mode)
The Telemetry > Debug page is available when Advanced > Settings > Advanced options is enabled. It provides support-assisted diagnostic controls for the cellular telemetry module. It is not required for routine SmartSampler2 operation.
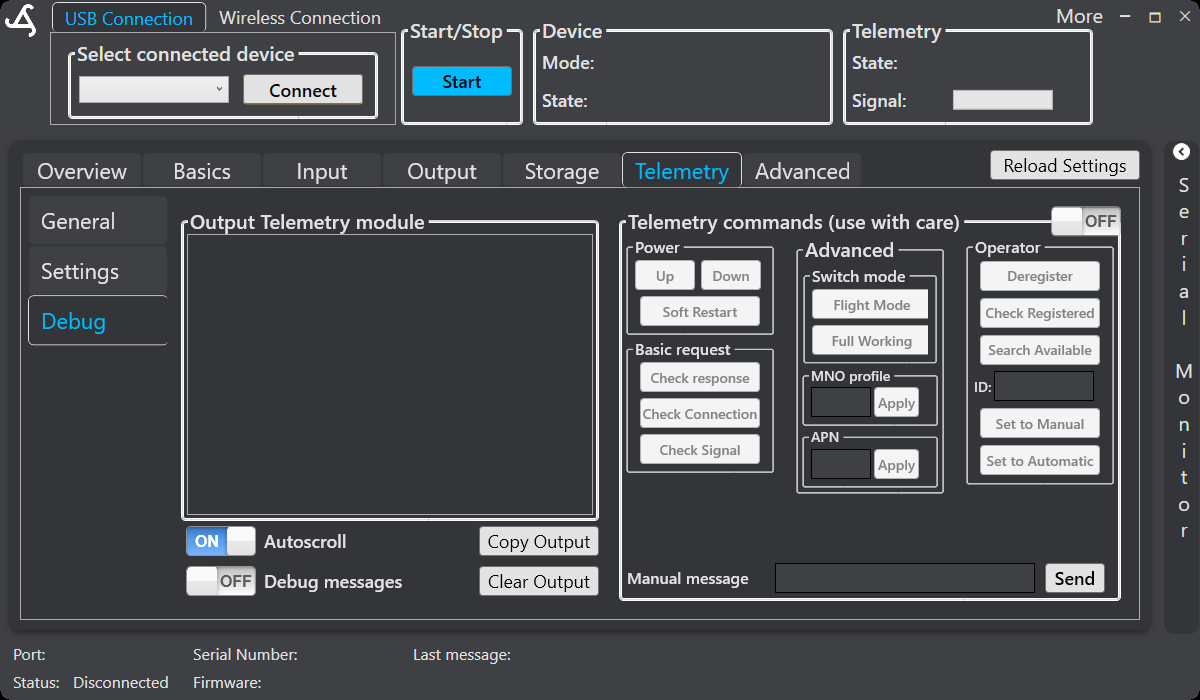
Open the Debug view
- Connect SmartConfig2 to the SmartSampler2 through USB or the supported wireless connection.
- Open Advanced > Settings and enable Advanced options.
- Open Telemetry, then select Debug.
- Enable the telemetry commands switch only when directed by Smart Sampler Solutions or an authorized support contact.
Advanced visibility is controlled by Advanced settings > Advanced options. The Debug view shown includes the connection selector, Connect and Start controls, the telemetry output panel, and the status bar.
Diagnostic controls
With the telemetry commands switch enabled, the page provides the following support-oriented controls:
- Power – Send Up, Down, or Soft Restart commands to the telemetry module.
- Basic request – Request a module response, connection information, or signal information.
- Advanced switch mode – Select Flight Mode or Full Working when instructed by support.
- MNO profile and APN – Enter and apply support-provided values when required for cellular troubleshooting.
- Operator – Deregister, check registration, search for available operators, or set operator selection to manual or automatic. Use manual selection only for a directed test, then return to automatic selection when appropriate.
- Manual message – Enter a support-directed message and select Send.
The output panel displays responses from the telemetry module. Use Autoscroll to keep the newest output visible, Copy Output to copy diagnostic output for an approved support request, and Clear Output to start a new test. Debug messages adds additional diagnostic feedback when enabled.
Interpreting connection status
Interpret the telemetry indicators together. SmartConfig2 distinguishes the SmartSampler2 connection, cellular network connection, and telemetry-server connection. A responding cellular module or registered cellular network does not by itself confirm that the telemetry server connection is available.
During connected operation, SmartSampler2 checks the server connection, maintains the connection, and polls for incoming supported messages. Telemetry data can be queued during a temporary interruption and handled when the server connection is restored.
GPS and telemetry information
When GPS is enabled through the telemetry system and a valid fix is available, SmartSampler2 can report location information to SmartConfig2. Depending on the available telemetry data, the interface can display the received coordinate representation, formatted coordinates, altitude, GPS time, and fix-related information.
Safe support workflow
- Do not use modem power controls, manual messages, or operator selection during routine operation unless instructed by support.
- After testing, return operator selection to automatic mode where appropriate and disable the telemetry commands switch and Advanced options.
- Do not disconnect the antenna or telemetry wiring while SmartSampler2 is powered.
- For physical connection checks, follow the SmartSampler2 hardware interface guidance.
- For LED, power, connector, or water-ingress checks, see SmartSampler2 Diagnostics & Maintenance.
For telemetry configuration, see 4.5.2 Settings. For the initial connection workflow, see 4.5.4 First-Time Network Connection.
Related hardware: SmartSampler2 hardware reference.